


A simple cutoff can hide valuable health information. New research suggests that how we interpret test results matters just as much as the measurements themselves.
The problem with normal and abnormal
Have you ever opened a lab report and seen a result highlighted in red and marked "abnormal"?
It can be alarming. But does an abnormal result always mean something is wrong? And does a "normal" result always mean everything is fine? Not necessarily. Many patients now see their lab results in online portals before their clinicians have reviewed them. This transparency is welcome, because it gives people greater access to their own health information.
But there is a catch.
Most lab reports show results alongside a reference range, with a simple cutoff separating "normal" from "abnormal." That makes results easy to read, but it can also create false alarms from abnormal results and false reassurance from normal ones.
Human biology rarely fits neatly into two categories. A number just outside the reference range may have little clinical significance, while a result well within it may still deserve attention, depending on the individual. A recent article in *The Conversation* caught our attention because it explores this problem through practical examples from everyday medicine.
When a simple cutoff tells the wrong story
Consider two familiar blood tests.
D-dimer: When abnormal may not mean alarming
D-dimer is a blood test commonly used to help doctors evaluate whether a patient might have a blood clot, particularly in the lungs.
A common cutoff is 500 nanograms per milliliter (ng/mL). Results above that threshold are often flagged as abnormal.
But a D-dimer result of 600 is not equivalent to a result of 5,000.
In fact, research suggests that some values between 500 and 1,000 can be reassuring in patients who already had a low likelihood of a blood clot. Interpretation depends on the patient's clinical risk, age, and the test used.
The label "abnormal" does not capture these distinctions.
Cholesterol: When normal may not be good enough
Now consider LDL cholesterol, often called "bad" cholesterol.
An LDL level below 100 milligrams per deciliter (mg/dL) is commonly considered desirable. Yet for someone who has already had a heart attack or stroke, guidelines may recommend a much lower target, such as 55 mg/dL. A result of 85 could therefore be acceptable for one person but above the recommended target for another.
The number has not changed. The clinical context has. These examples illustrate an important principle: A test result does not have a universal meaning independent of the person being tested.
A better approach: Interpreting ranges instead of relying on a single cutoff
Normal and abnormal labels are useful. They simplify complex information, make lab reports easier to scan, and help clinicians quickly spot results that may need attention. But that simplicity has a cost: important information can get lost. Researchers are exploring ways to present lab results with more nuance. One promising method uses a statistical measure called an interval likelihood ratio.
The concept is straightforward. Instead of sorting results into two categories, researchers examine how different ranges of values relate to the probability of a particular diagnosis. A result just above a cutoff may change the probability of disease very little, while a result far above the same cutoff may raise it substantially. An interval likelihood ratio describes how strongly a result within a given range supports or argues against a diagnosis.
This approach keeps information that a single cutoff would discard. The goal is not to eliminate normal and abnormal labels. It is to give clinicians better tools for interpreting what a numerical result means for an individual patient.
Does more information actually lead to better medical decisions?
A study published in June 2026 in NEJM Evidence suggests it does.
Researchers recruited 611 clinicians from four major U.S. academic institutions for a randomized experiment. Each participant reviewed two hypothetical patient cases: one involving a possible pulmonary embolism (a blood clot in the lungs) and another involving heart failure treatment decisions. Every participant received the same clinical information and numerical test results. Only the presentation of the diagnostic information differed. Some clinicians saw a single numerical cutoff. Others saw traditional binary test characteristics. A third group received interval likelihood ratios, which show how different ranges of test results change the likelihood of disease.
The results were striking.
Across both scenarios, clinicians who received interval likelihood ratios made the correct management decision 93.4% of the time. Those shown a single cutoff did so 82.2% of the time, and those shown conventional binary test characteristics did so 75.1% of the time. That is an improvement of more than 11 percentage points over the cutoff-only group. The same test result led to better decisions when it came with more informative interpretation.
The study has limitations. It used hypothetical cases rather than real patients, and it does not show that the same improvement would occur across all medical tests or clinical settings. Still, it points to something important: how health information is presented affects how well we use it. It also raises a question for the future of healthcare. If we already measure numerical values, why discard useful information by reducing them to a yes-or-no answer?
What does this have to do with gut health?
At Coprata, this question hits close to home.
One measurement we study is fecal pH, which shows how acidic or alkaline the gut environment is.
Fecal pH is not a new biomarker. Researchers have studied it for decades, and it is closely tied to how gut microbes process food.
When gut bacteria ferment dietary fibers and other substrates, they produce short-chain fatty acids (SCFAs), including acetate, propionate, and butyrate. These compounds support the gut barrier, help regulate inflammation, and influence metabolism. Producing them can also make the gut more acidic, which fecal pH reflects.
The relationship is not one-to-one, though. Diet, transit time, intestinal absorption, and microbial activity all affect fecal pH, and it does not directly measure SCFA concentrations.
Clinically, fecal pH testing has mostly focused on specific digestive conditions, such as carbohydrate malabsorption, where very acidic stool can offer useful clues. But research has also found differences in fecal pH across populations with different diets, microbial activity, and health characteristics.
These differences suggest fecal pH may tell us more than a single diagnostic cutoff can.
The Coprata approach: A spectrum, not simply good or bad
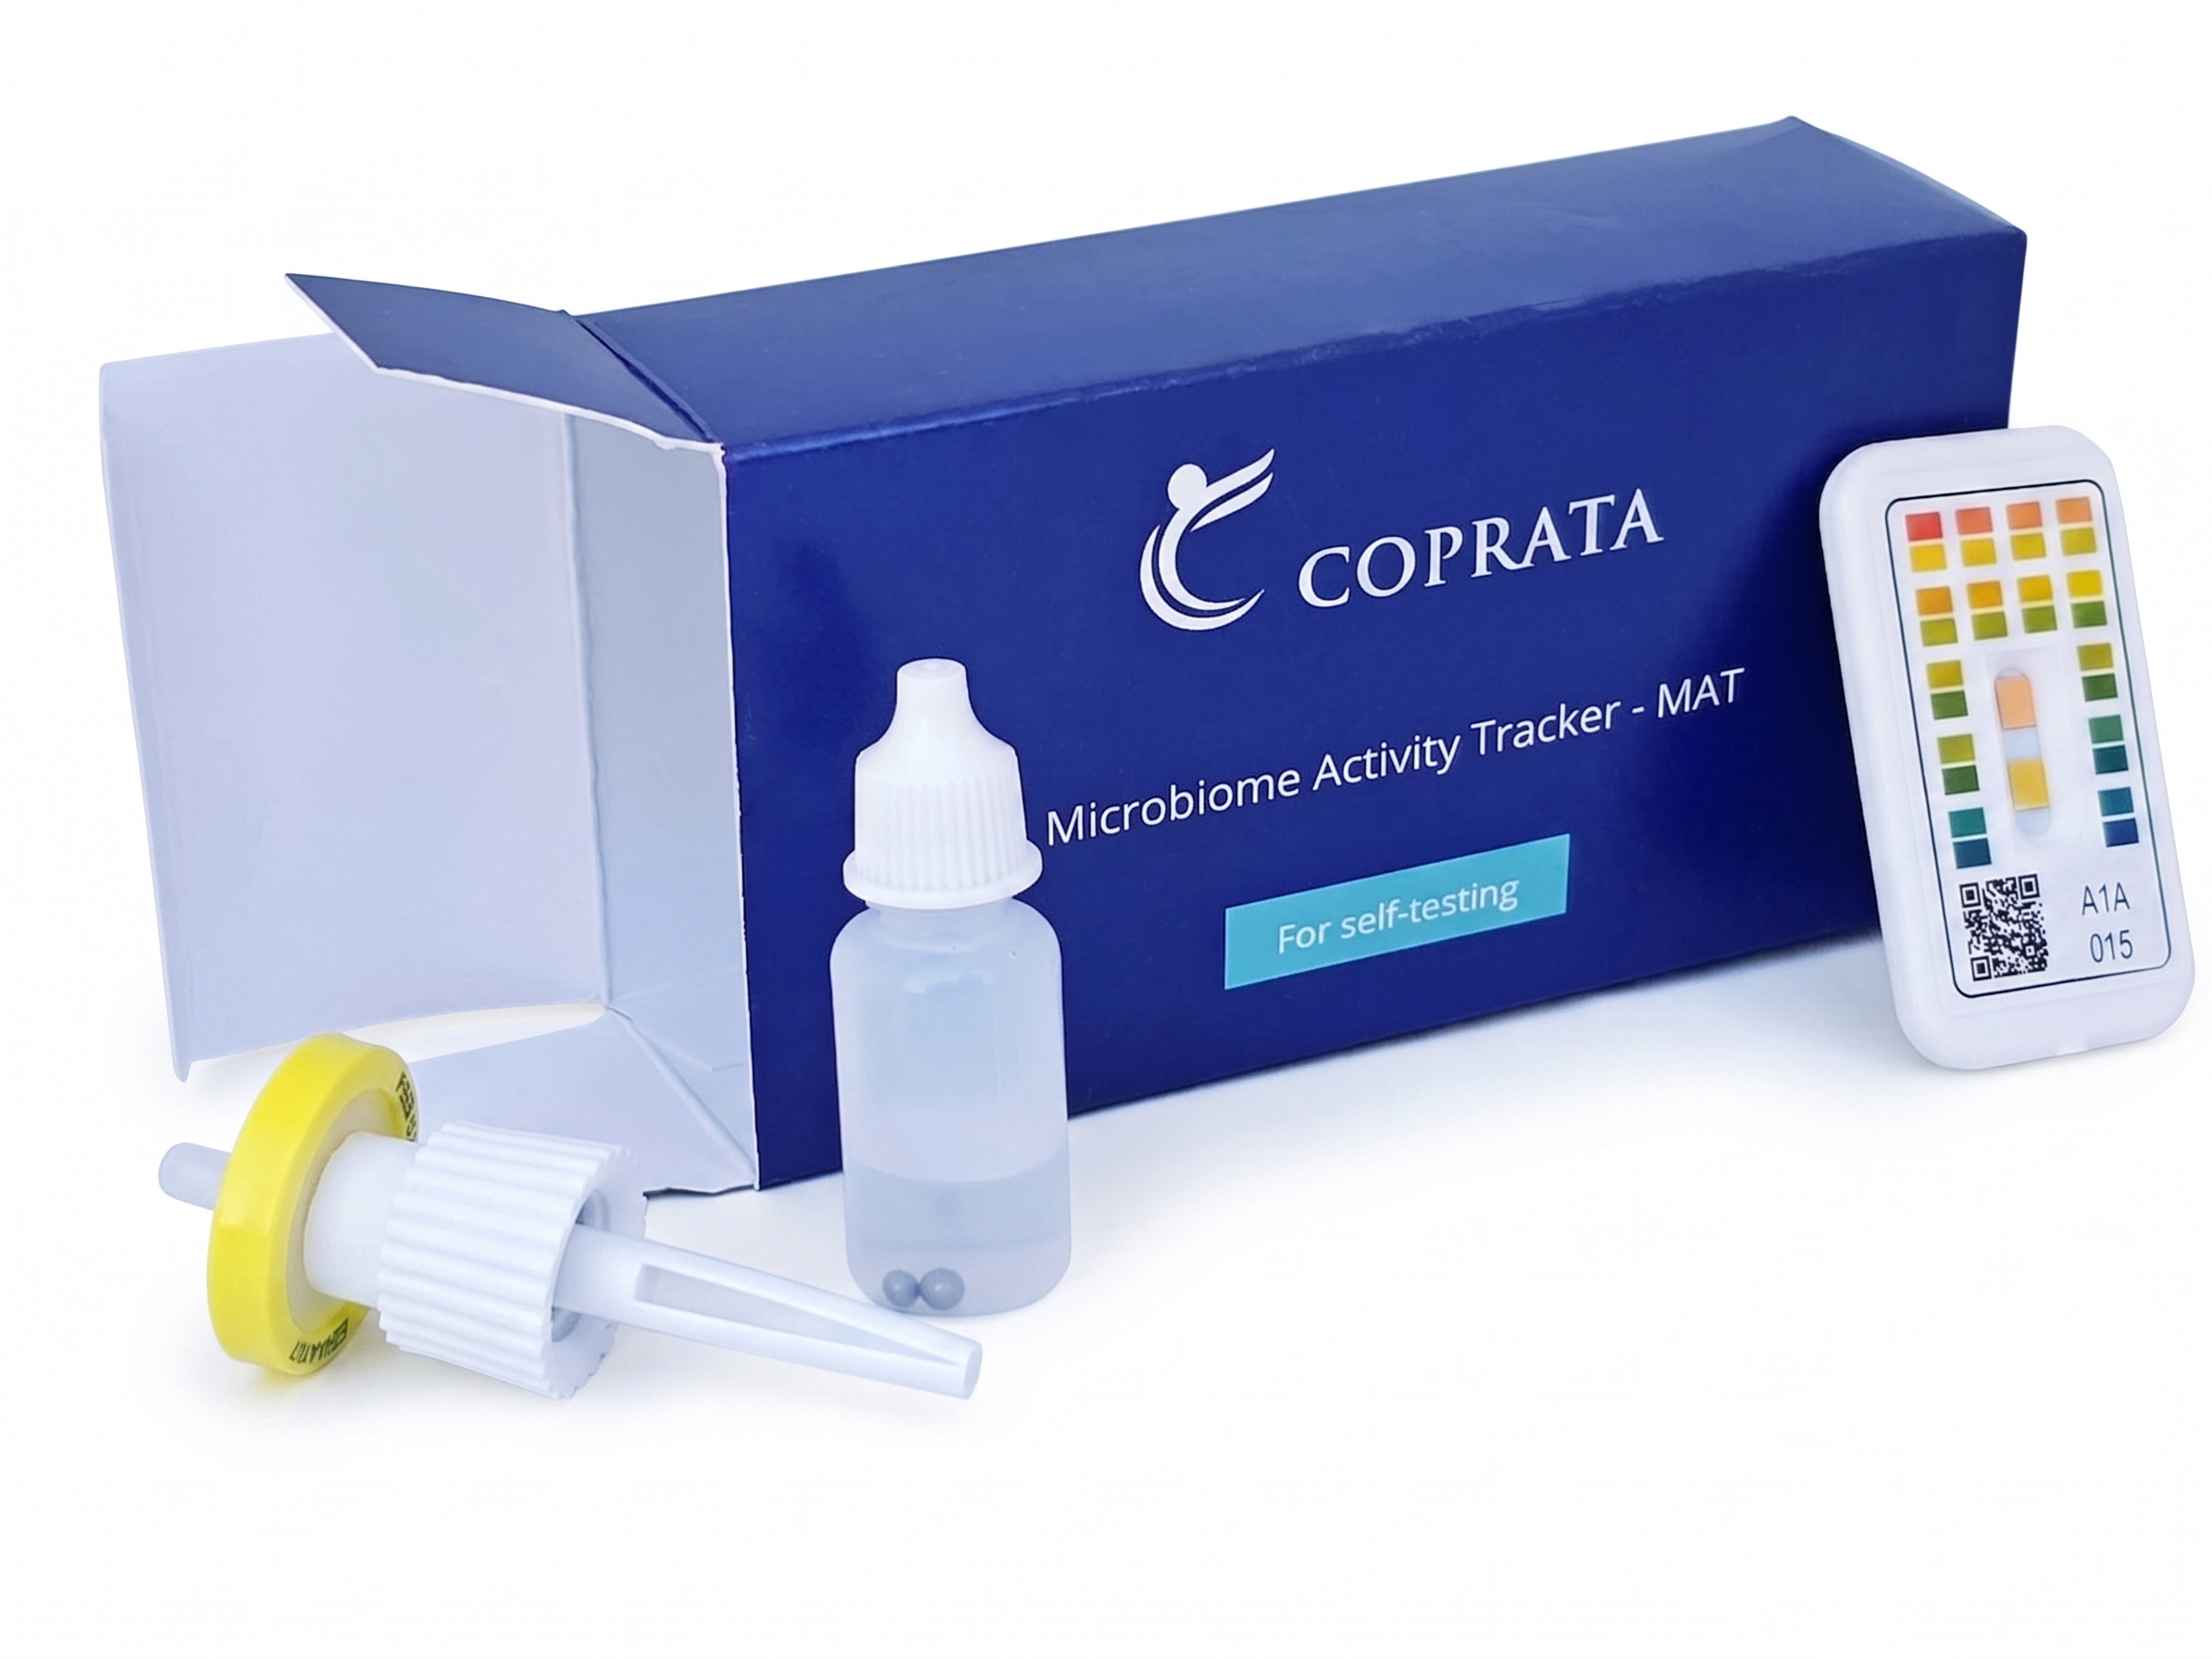
That is the principle behind Coprata's [**Microbiome Activity Tracker (MAT)**](https://www.coprata.com/test-kit).
Rather than report fecal pH as simply normal or abnormal, MAT translates the measurement into an easy-to-understand gut health score from 1 to 10, informed by research on fecal pH and how it is distributed across individuals.
The goal is not to diagnose disease. It is to make a biological measurement more accessible and meaningful.
A fecal pH value should not be read in isolation, or assumed to be better just because it is higher or lower. An intermediate, mildly acidic range is generally associated with favorable microbial fermentation, while values at either extreme may need more context.
MAT's score places a measurement along a spectrum instead of forcing it into a binary category.
There is another important dimension: change over time. Your gut microbiome is dynamic. Shifts in diet, fiber intake, medication, or lifestyle can influence microbial activity, sometimes gradually over weeks. A single measurement is a snapshot. Repeated measurements can reveal patterns.
For example, someone who increases their fiber intake may want to know whether their gut environment changes over the following weeks. MAT lets users follow their scores over time and consider changes alongside their diet, digestive symptoms, and other health information. A change in score does not necessarily mean a change in overall health, and fecal pH alone cannot establish the cause. But tracking it over time can provide useful context for understanding how the gut environment responds.
The parallel with the new research on diagnostic tests is conceptual, not statistical. MAT does not calculate interval likelihood ratios or predict the probability of a specific diagnosis. It simply shares a similar philosophy: numerical measurements are more informative when interpreted with nuance rather than reduced to a binary label.
Better measurements deserve better interpretation
People now have unprecedented access to health data, from laboratory tests and wearable sensors to at-home testing kits. But collecting more data is only part of the challenge. The greater opportunity lies in turning those measurements into information people can understand, follow, and act on.
The same number can tell very different stories depending on how it is presented and interpreted. Biology is rarely black and white, and our approach to health measurements should reflect that complexity. Rather than relying solely on population-level definitions of "normal" and "abnormal," we should make room for nuance, individual differences, and personal trends over time.
The Microbiome Activity Tracker is intended for informational and wellness purposes only. It is not a diagnostic test and is not intended to diagnose, treat, cure, or prevent disease.
References
- Goryachok M, Liu J, Benjamin T, et al. A Randomized Trial of Interval Likelihood Ratios for Clinical Decision-Making. NEJM Evidence. 2026;5(7):EVIDoa2500249. doi:10.1056/EVIDoa2500249
- Baduashvili A. I teach doctors how to interpret test results, and the labels "normal" and "abnormal" often hide what matters most. The Conversation. October 12, 2026.